

Mobile Ecommerce Statistics 2026: Market & City Analysis

Mobile ecommerce statistics in 2026 reveal a clear shift toward price-sensitive buying, category concentration, and city-level demand imbalances. With tools like Shiprocket Trends by Shiprocket, brands can track real-time mobile order volumes, category performance, pricing trends, and regional demand shifts to make data-backed decisions.
Recent insights show a declining monthly order trend from November 2025 to February 2026, with a steep drop in February to 10.07 million orders. This suggests seasonal slowdowns and possible external market influences impacting mobile commerce performance.
Understanding these mobile ecommerce statistics is critical for brands planning pricing strategies, inventory allocation, and regional expansion in 2026.
In this blog, we analyze:
• Monthly order trends
• Category-wise dominance
• Pricing behavior insights
• Tier-wise city performance
• Seasonal decline patterns
• Growth predictions for 2026
What Do Mobile Ecommerce Statistics Show in 2026?
Mobile ecommerce statistics reflect purchasing behavior, smartphone-led order volumes, price sensitivity, and category concentration.
Recent data highlights:
• A consistent decline in monthly orders
• A sharp drop in February 2026
• Heavy reliance on two dominant product categories
• Strong preference for affordable price segments
• Similar performance between Tier-1 and Tier-3 cities
While mobile continues to dominate ecommerce transactions, demand remains uneven across pricing bands and regions.
Monthly Order Trend: November 2025 to February 2026
One of the most important mobile ecommerce statistics in early 2026 is the downward order trajectory.
Key observation:
• February 2026 recorded 10.07 million orders — the lowest in the observed cycle
Possible drivers:
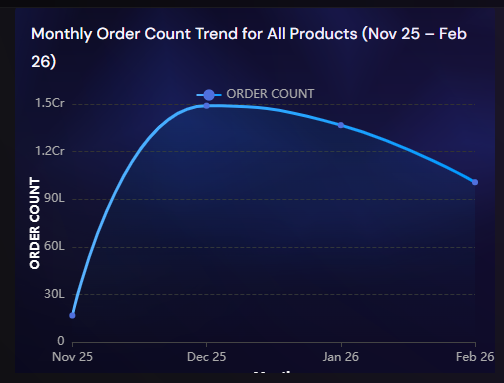
- The data reinforces that Q4 remains the strongest mobile sales window, while Q1 requires stabilization strategies.
- Category Dominance: 50% Orders from Two Segments
- Mobile ecommerce statistics show strong category concentration.
- Health & Beauty and Apparel & Accessories together contribute nearly 50 percent of total mobile orders.
- Post-holiday spending fatigue
- Reduced Q1 promotional campaigns
- Consumer stockpiling during Q4
- Macro-economic or seasonal corrections
This suggests:
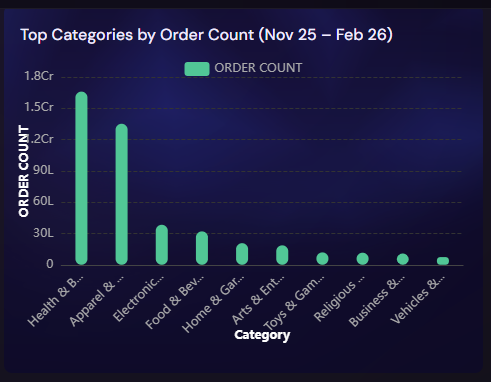
- Brands operating in these segments are structurally aligned with mobile consumption behavior.
- Pricing Trends: Budget & Mid-Range Dominate
- Pricing analysis reveals clear consumer psychology in mobile ecommerce statistics.
- High repeat purchase frequency
- Strong visual appeal on smartphones
- Impulse-driven buying behavior
- Heavy influencer and social media impact
Top-performing price brackets:
• ₹0–₹250
• ₹250–₹500
These segments account for the majority of mobile purchases, indicating:
• Budget-conscious consumers
• Higher conversion rates for affordable items
• Faster decision-making on smartphones
• Preference for value-driven products
Premium segments above ₹2000 record the lowest engagement, highlighting pricing resistance in mobile-first shopping journeys.
Tier-Wise Order Distribution
City-level data presents one of the most interesting mobile ecommerce statistics in 2026.
Order volumes:
• Tier-1 cities: ~16.7 million orders
• Tier-3 cities: ~16.7 million orders
• Tier-2 cities: ~10.6 million orders
Tier-3 cities matching Tier-1 metros signals:
• Rising digital adoption in smaller towns
• Improved logistics penetration
• Growing trust in mobile payments
• Expansion of vernacular and regional marketing
Tier-2 cities lag significantly, suggesting untapped growth potential.
Seasonal Patterns & Market Signals
The February decline to 10.07 million orders indicates that mobile ecommerce is highly seasonal.
Key insights:
• Q4 remains the peak revenue period
• February shows demand correction
• Promotions strongly influence mobile conversion rates
Brands that proactively plan Q1 recovery campaigns can smooth revenue volatility.
Growth Predictions for 2026
Based on current mobile ecommerce statistics, the outlook includes:
• Continued dominance of low and mid-priced segments
• Strong performance in Tier-1 and Tier-3 markets
• Increasing competition in Health & Beauty and Apparel
• Greater emphasis on retention strategies post Q4
• Rising importance of mobile-first user experience
Strategic Recommendations
• Focus on ₹0–₹500 pricing bands
• Expand marketing in Tier-3 cities
• Strengthen Q1 promotional recovery campaigns
• Optimize mobile checkout flows
• Introduce loyalty and repeat purchase programs
Final Takeaways
• February 2026 saw a drop to 10.07 million orders
• Two categories drive nearly half of mobile demand
• Budget pricing dominates purchasing behavior
• Tier-3 cities now match Tier-1 order volumes
• Tier-2 markets represent growth opportunities
• Seasonal planning is essential for revenue stability
Mobile ecommerce in 2026 is driven by affordability, category concentration, and regional expansion. Brands aligning with these mobile ecommerce statistics will be better positioned for sustainable growth in a mobile-first economy.


