35+ KPIs you Must be Tracking for Your eCommerce Store

- What are Key Performance Indicators or KPIs?
- eCommerce KPIs for Manufacturing
- KPIs for Ensuring eCommerce Marketing Success
- eCommerce KPIs for Tracking Sales
- Average Order Value (AOV)
- Gross Profit
- Conversion Rate (CR)
- Shopping Cart Abandonment Rate (CAR)
- Shopping Cart Conversion Rate (CCR)
- Cost of Goods Sold (COGS)
- Customer Lifetime Value (CLV)
- Churn Rate
- Customer Acquisition Cost (CAC)
- Repeat Purchase Rate (RPR)
- Average Profit Margin
- Revenue Per Click (RPC)
- Purchase Frequency
- Time Between Purchases
- eCommerce KPIs for Tracking Customer Success
- Final Thoughts
When you run an eCommerce website, it is imperative to track the results of your initiatives. Running an eCommerce website requires you to take initiatives on various fronts like marketing, sales, customer service, etc. You must have definite performance metrics to check if your endeavors to achieve business objectives are successfully working.
But, what are these performance metrics or indicators, and how can you measure them? Let’s have a look –
What are Key Performance Indicators or KPIs?
Key Performance Indicators (KPIs) are values or measurable indicators that give you a definite idea about how your initiatives perform. They help you measure your actions’ success and provide you with insight into your eCommerce store’s performance.
A few standard eCommerce KPIs include average order value, cart abandonment rate, etc. Though these are critical metrics, there are several more that you must be tracking to be on top of your eCommerce game.
You must track the performance of your store in every category. These categories include –
- Manufacturing
- Marketing
- Sales
- Customer Service
Let’s dive deeper to see the significant KPIs you must track for each segment.
eCommerce KPIs for Manufacturing
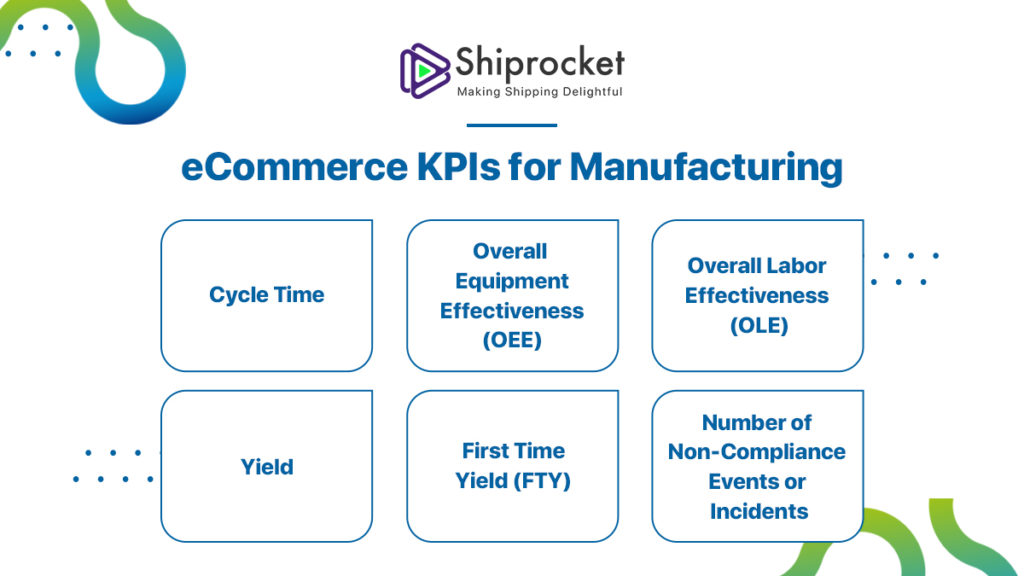
Cycle Time
Cycle time refers to the time required for manufacturing one product from time to finish. It helps you determine the efficiency of your operations and how the production efficacy can be increased.
Cycle Time = Total Parts Produced / Production Run Time
Overall Equipment Effectiveness (OEE)
This KPI is a measure of how well the equipment is performing and manufacturing productivity.
OEE = (Ideal Cycle Time × Total Count) / Run Time
Overall Labor Effectiveness (OLE)
OLE gives you insight into how effectively your staff is performing.
Yield
Yield refers to the total number of products manufactured. Measure this regularly to check how much you deviate or progress from the average amount.
First Time Yield (FTY)
The first-time yield is a quality-based KPI that measures the wastefulness of your production process. It helps you determine the scope of improvement in your process.
FTY = Total Number of Successfully Manufactured Units / Total Number of Units That Started the Process
Number of Non-Compliance Events or Incidents
When you work in a production setup or manage one, licenses or permissions are an integral aspect you need to comply with. Therefore, this metric will help you keep track of the non-compliances and how you can reduce them.
KPIs for Ensuring eCommerce Marketing Success
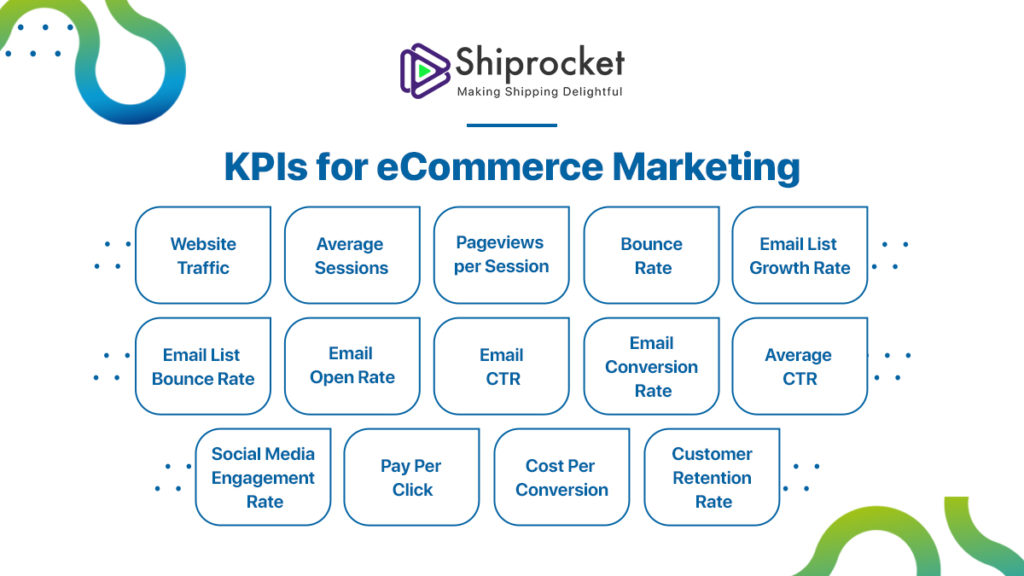
Website Traffic
Website traffic refers to the total number of users who visit your website. You can segregate this further into new users to analyze your performance much better. This number can be obtained from the tracking software or solution you install on your website, for example – Google Analytics.
Average Sessions
Average sessions refer to the time a visitor spends on your website during a single visit.
Average sessions = Total Session Duration / Total Number of Session
Pageviews per Session
This tells you about the average number of website pages a visitor views in a single visit. If this number is high, it can indicate that the user is having problems navigating on your website or is facing too many distractions.
Pageviews per Session = Total Number of Pageviews / Total Number of Visitors
Bounce Rate
The bounce rate gives you information about how many visitors leave your website after viewing just one page. For an eCommerce website, this number must be as low as possible if you want to increase sales.
Bounce Rate = Total Number of One-page Visits / Total Number of Entries to a Website.
Email List Growth Rate
You must calculate the email list’s growth rate as it tells you about the users who have signed up for your emails.
Email List Growth Rate = [(Total Number of New Subscribers – Total Number of Unsubscribes) / Total Subscribers ] x 100
Email List Bounce Rate
Email bounce rate refers to the number of undelivered emails sent to the visitor’s email address.
Email Bounce Rate = (Total Number of Emails that Bounced / Total Number of Emails Sent) x 100
Email Open Rate
Percentage of recipients who opened your email.
Email Open Rate = (Total Number of Unique Open / Number of Total Emails Sent Successfully) x 100
Email CTR
Percentage of recipients who clicked on the links provided in your emails.
CTR = (Total Number of Individuals Clicks / Total Number of Email Opens) x 100
Email Conversion Rate
It is the number of people who successfully purchase from your website after engaging with your email.
Email Conversion Rate = (Total Number of Conversions from Emails / Total Number of Emails Sent) x 100
Average CTR
Average CTR refers to the number of people who clicked your email. It is calculated as the total click count divided by the total impressions.
Average CTR = Total Number of Clicks That an Ad Receives / Total Number of Impressions
Social Media Engagement Rate
Social media engagement rate refers to the number of likes, comments, shares, etc. You get on the posts that you share.
Pay Per Click
This refers to the amount spent on every click of the ads that your running. It is a useful KPI for your paid campaigns on Google and Facebook.
PPC = Total Advertising Cost / Total Number of Ads Clicked
Cost Per Conversion
It is the amount you spend to turn a visitor into a customer.
CPC = Total Cost for Generating the Traffic / Total Number of Conversions
Customer Retention Rate
Customer retention rate refers to the percentage of customers who return to your website and buy.
Customer Retention Rate = [(Number of Customers at the End of a Period – Total Number of New Customers during That Period) / Total Number of Customers at the Start of That Period] x 100
eCommerce KPIs for Tracking Sales
Average Order Value (AOV)
Average Order Value tells you the average amount your customers spend on each order.
AOV = Total Revenue / Number of orders.
Gross Profit
This eCommerce KPI tells you about the total profit you made in a specific period. It is essential for planning your future strategies.
Gross Profit = Total Cost of Goods Sold – Total Number of sales.
Conversion Rate (CR)
The conversion rate is the percentage of conversions that are happening in your store.
Conversion Rate = (Total Number of Visitors on the Website / Total Number of Conversions) x 100
Shopping Cart Abandonment Rate (CAR)
The shopping cart abandonment rate tells you about the users who add products to their cart but do not make a final purchase. It means that you need to make the cart checkout process more uncomplicated.
CAR = (Total Number of Completed Transactions / Total Number of Shopping Carts) x 100
Shopping Cart Conversion Rate (CCR)
Shopping cart conversion rate refers to the successful conversions or the percentage of visitors who successfully purchase on your website.
CCR = (Total Conversions / Total Number of Visitors) x 100
Cost of Goods Sold (COGS)
It represents the total amount you’re spending to sell the product. These include all costs like overhead, shipping, production, marketing, etc.
COGS = Beginning Inventory Costs (of the year) + Additional Inventory Costs (purchased during the year) – Ending Inventory (at the end of the year)
Customer Lifetime Value (CLV)
Customer Lifetime Value tells you about the quality of each consumer. It is one of the most critical KPI as it encompasses all the critical KPIs.
CLV = (Customer’s Annual Profit Contribution x Average Number of Year as Customer) – the Initial Cost of Customer Acquisition
When evaluating CAC, it’s important to consider how it aligns with long-term customer value. A higher acquisition cost may be justified if efforts also help improve customer lifetime value, leading to better returns over time.
Churn Rate
Churn rate represents the rate at which your customers are moving on from your brand and canceling the subscriptions. Try to keep this number as low as possible and track it continuously.
Churn Rate = (Number of lost customers / Total number of customers) x 100
Customer Acquisition Cost (CAC)
Customer Acquisition Cost tells you about the amount you spend on acquiring each new customer.
CAC = Costs Spent on Acquiring Customers / Number of Customers Acquired
Repeat Purchase Rate (RPR)
This metric tells you about the number of customers who return to your store for making a purchase. It gives you an idea about the time between a first purchase and the repeat purchase and the rate at which they make these purchases.
RPR = Purchases from Repeat Customers / Total Purchase
Average Profit Margin
The average profit margin tells you how much profit you have made over a specified period.
Average Profit Margin = Gross Profit / Revenue
Revenue Per Click (RPC)
Average revenue from each click for your pay per click (PPC) campaigns.
RPC = Revenue / Total Number of Clicks
Purchase Frequency
It is the average number of orders made in a specific period.
Purchase Frequency = Total Number of Orders / Total Number of Unique Customers
Time Between Purchases
The time between the first and the second purchase. It is a great KPI to determine how well your audience perceives your products.
Time between Purchases = Purchase Frequency / 365
eCommerce KPIs for Tracking Customer Success
Net Promoter Score (NPS)
The net promoter score or NPS is a measure of how well you are servicing your customers. It tells you if your customers will recommend your brand to others.
It is usually on a scale of 1-10 where one stands for least likely, and ten stands for most likely.
With the help of NPS, you can distinguish between three types of buyers.
Promoters = respondents giving a 9 or 10 score
Passives = respondents giving a 7 or 8 score
Detractors = respondents giving a 0 to 6 score
NPS = % of Promoters – % of Detractors.
Customer Service Email Count
It represents the total number of emails your customer service team receives from buyers.
Average Complaint Resolution Time
It is the total time taken for an eCommerce customer executive to resolve an active query or complaint.
Avg. Complaint Resolution Time = (Number of Customer Service Requests – Total Number of Unresolved Request) / Total Number of Requests Received
Refund/Return Rate (RR)
It tells you about the rate at which you are receiving RTO requests and refunds. If this number is too high, it could mean that you need to make amends to your products or switch to a better shipping method like Shiprocket.
Final Thoughts
Tracking eCommerce KPIs is an essential part of your business strategy. Hence, you must be regular in keeping a check on these numbers and measure your progress regularly. These will help you get a better understanding of your initiatives.